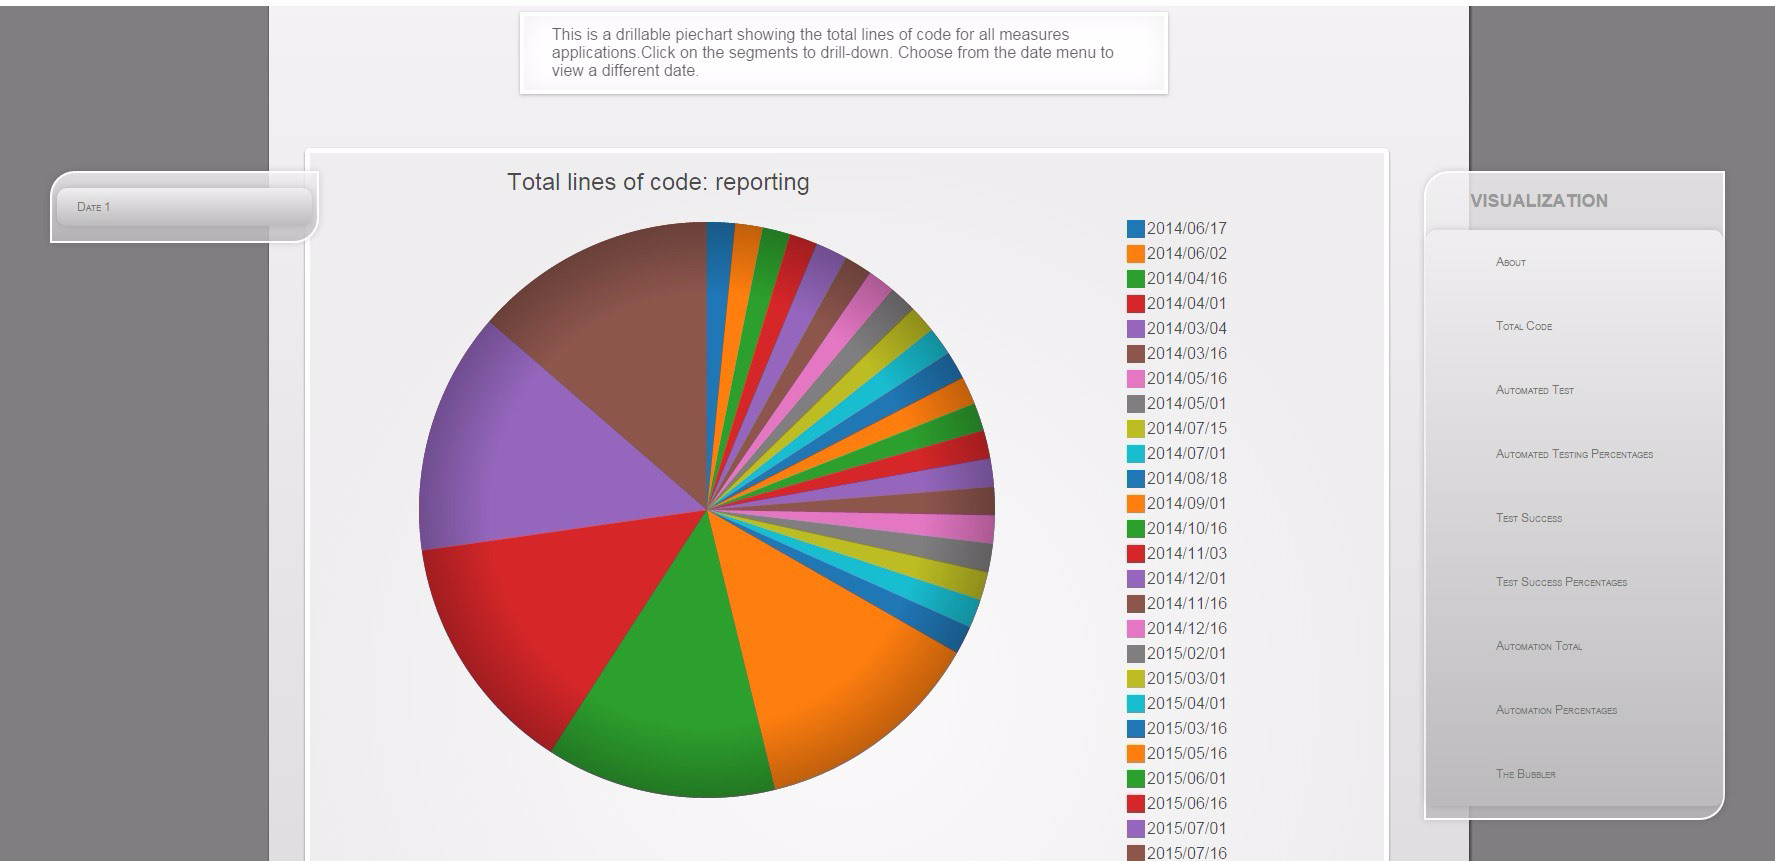
Drillable analytics dashboard showing bi-monthly code testing coverage based on project group.
Date comparison for code testing analysis uses 3 dates chosen by the user or defalut of most recent, 6 months ago, and one year ago. Built using d3.js. The code testing app is linked to the database by php.
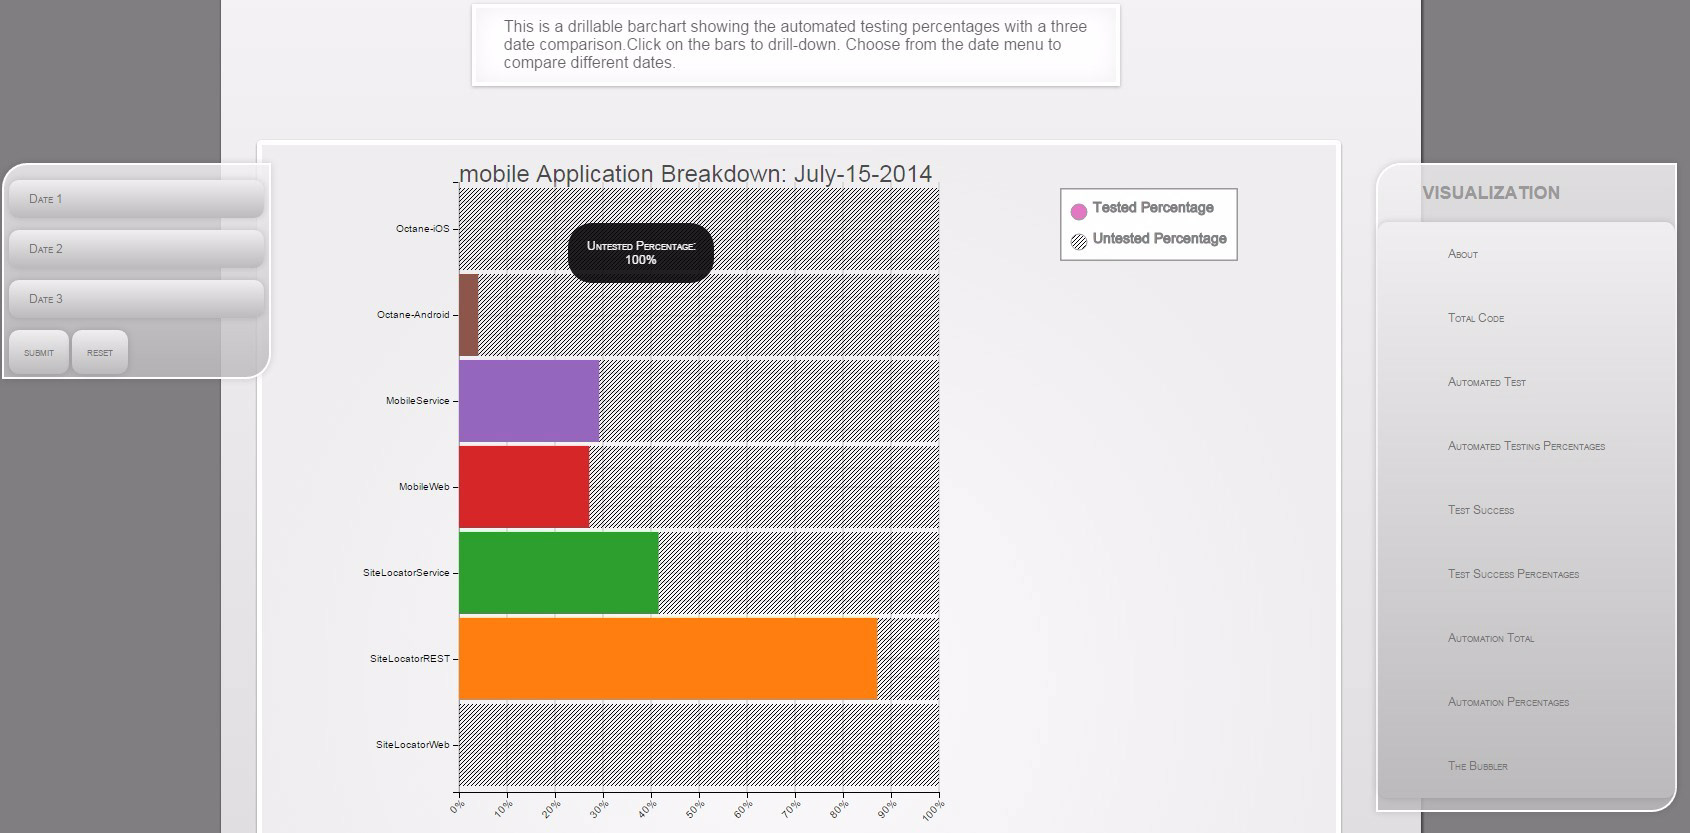
I used svg patterns to create the shaded effect on the percentage based analysis.
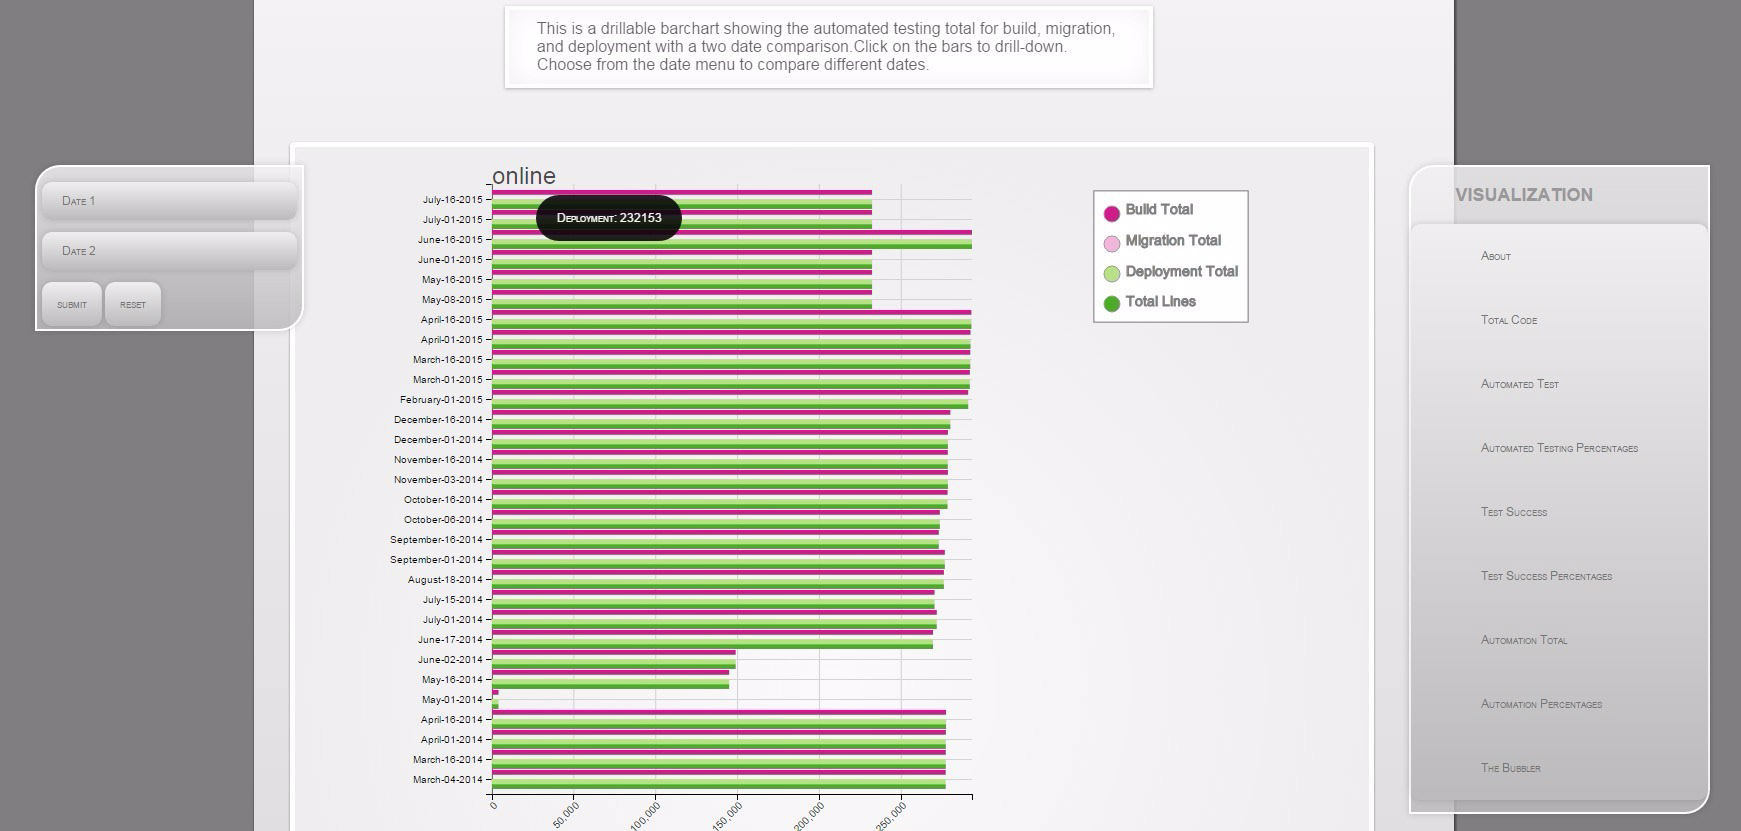
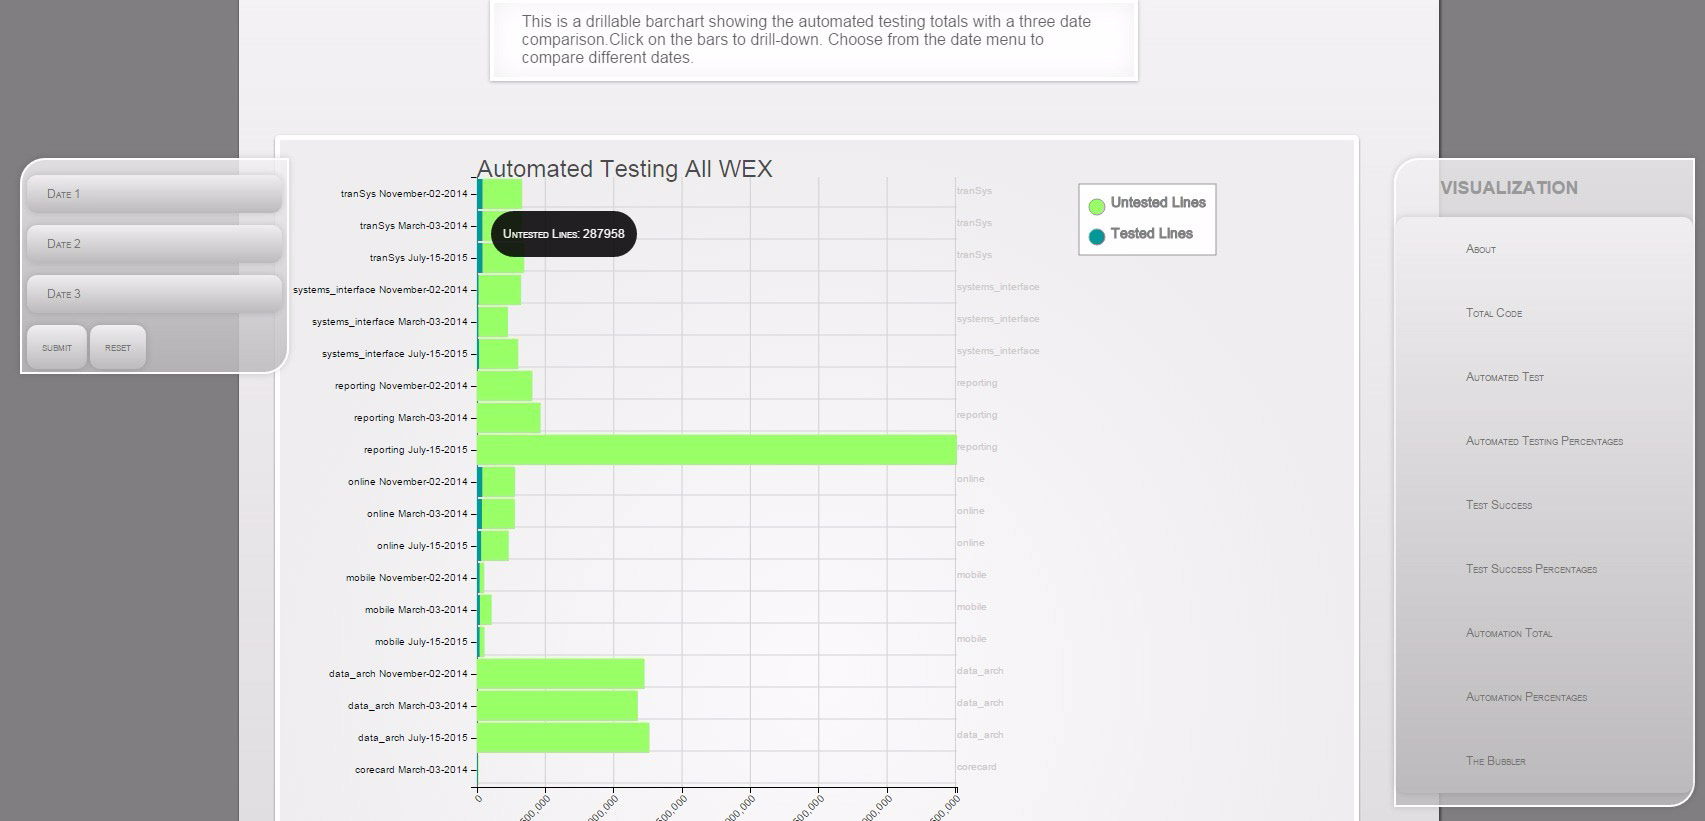
Formally the analysis of code testing was done using Microsoft Excel. I created the data structures using object orientated javascript from the streaming data. Here three testing metrics are compared side by side. All of the charts are drillable.

I really enjoy this bubble chart. The bubbles fly in to view when the page loads. Each bubble's size represents the total amount of code written and when you click on the bubble the testing coverage is displayed as a circumfrance of varied thickness depending on the percentage covered.